Image/Video Gallery

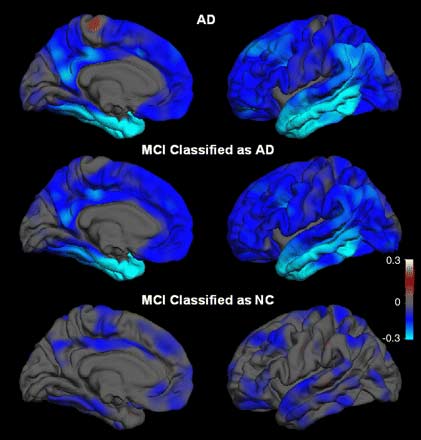
Image shows the average differences in brain thickness for subjects with Alzheimer’s disease (AD) and mild cognitive impairment (MCI). The blue areas indicate regions of thinning from the disease.
-Top: Healthy control (HC) subjects versus subjects with AD.
-Middle: HC subjects versus subjects with MCI who had AD imaging phenotype (an observable trait).
-Bottom: HC subjects versus subjects with MCI who had HC imaging phenotype.
Note: Images are shown for illustrative purposes. Do not attempt to draw conclusions or make diagnoses by comparing these images to other medical images, particularly your own. Only qualified physicians should interpret images; the radiologist is the physician expert trained in medical imaging.


